


Not for Profit
Providing Non-governmental Organizations (NGOs) with intelligence to support their objectives.

Retail
Detect and prevent fraudulent activity that affects business operations.
Reveal insights
-
Exploit Unstructured Data
Identify the who, what, when, where, and sentiment in unstructured content in almost any language, and quickly transform it into analysis-ready data.
-
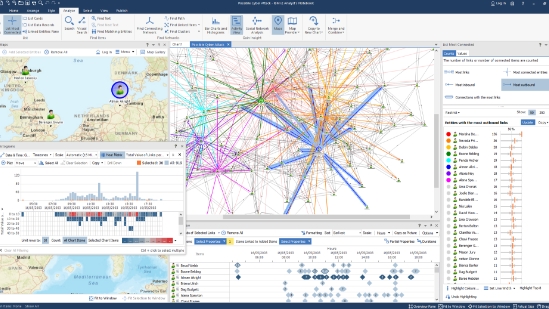
Geospatial Analysis
Combine link analysis with geospatial data to gain further insights such as routing and clustering.
-
Temporal Analysis
Powerful analysis and visualizations to analyze behavioral patterns, event sequences, and changes over time.
-
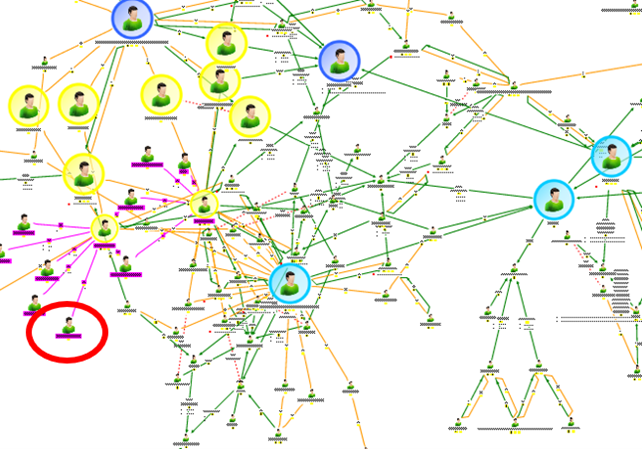
Social Network Analysis
Gain insight into network structures to determine key actors and influencers.
Connected i2 North America
Alexandria, VA, USA
May 22- 23, 2024
Join us at the Connected i2 User and Training Conference North America which will bring together the largest community of i2 users in the Americas... and beyond! Come and hear what's new in i2, develop your tradecraft skills, advance your skills with training, and take advantage of networking opportunities throughout.